Fixing Zenoss Device Network Interface Graphs
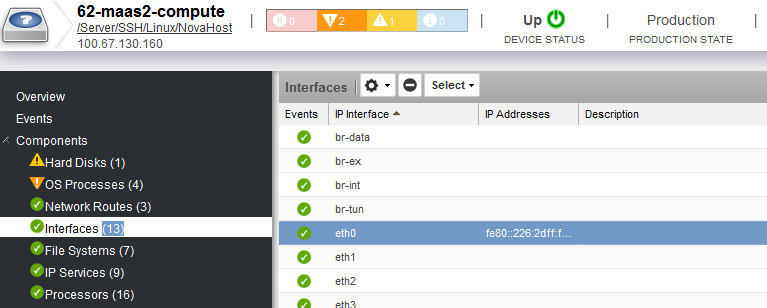
When testing the monitoring of the OpenStack compute node devices in Zenoss (using OpenStack Infrastructure ZenPack), I noticed that I could not get any graphs for the network interfaces of the device, although we could still get and model all the available interfaces:
This was indeed strange because I could perfectly get the graphs for other devices. After a lot of head scratching and prying around the code and interface, I finally found the reason, which I explain below.
Interface Monitoring Templates
Zenoss comes with two monitoring templates for the network interfaces, ethernetCsmacd and ethernetCsmacd_64. The first one is a standard ethernet network interface monitoring template, the second one is a smilar template but for 64-bit interface counters.
Both of the monitoring templates provide the graphs we need. But there is a slight “problem” between them and the /Server/SSH/Linux/NovaHost device class, which is where all the OpenStack devices are placed for monitoring.
If we take a look, ethernetCsmacd template is available in the following device classes:
- /Devices
- /Server/Cmd
- /Server/Microsoft
- /Server/SSH/Linux
- /Server/Windows/WMI
This monitoring template is different in each device class. This is why some of the device classes have different datasources and provide different graphs than others. From the list above, the device class of our interest is /Server/SSH/Linux because it is the closest one in the hierarchy to our NovaHost class.
However, when inspecting the available graphs and datasources for ethernetCsmacd in /Server/SSH/Linux, I discovered that it is completely blank! Upon further inspection I find a tooltip showing the template's description, which says “The SSH Ethernet interface template is available in the Enterprise version”.
This is conflicting because we do not want to collect this data through SSH, but through SNMP like it is done in the other device classes for this same monitoring template.
Now, if we take a look at ethernetCsmacd_64 template, we see that there is only one device class associated with it:
- /Devices
This device class will basically apply to all the devices in Zenoss. Additionally and more importantly, this template in this device class offers all the graphs we need.
How Zenoss Assigns the Interface Monitoring Template
The way Zenoss assigns the monitoring template for the network interfaces is very different from the assignment of other monitoring templates to other type of components. The assignment is based on the value of the interface type, obtained by Zenoss.
The source code for how this is done can be found in /Products/ZenModel/IpInterface.py:
def getRRDTemplates(self):
    """
    Return a list containing the appropriate RRDTemplate for this
    IpInterface. If none is found then the list will be empty.

    Order of preference if the interface supports 64bit counters:
      1. <type>_64
      2. ethernetCsmacd_64
      3. <type>
      4. ethernetCsmacd

    Order of preference if the interface doesn't support 64bit counters:
      1. type
      2. ethernetCsmacd
    """
    templateName = self.getRRDTemplateName()

    order = ['ethernetCsmacd']
    if templateName.endswith('_64'):
        order.insert(0, 'ethernetCsmacd_64')
        if templateName not in order:
            order.insert(0, templateName)
            order.insert(2, templateName[:-3])
    else:
        if templateName not in order:
            order.insert(0, templateName)

    for name in order:
        template = self.getRRDTemplateByName(name)
        if template:
            return [template]

    return []
Basically, Zenoss will check if the ethernet interface is of 64-bit type, if it is then it will assign the ethernetCsmacd_64 template, otherwise it will use the ethernetCsmacd template as a default fallback.
After discovering this, I proceeded to inspect the assigned template for the OpenStack compute node devices and the other devices where the graphs would display correctly. Sure enough, the interface type detected and assigned by Zenoss for the OpenStack compute node devices was ethernetCsmacd.
And this is what explains everything. Since the OpenStack devices (located in /Server/SSH/Linux/NovaHost) are assigned the ethernetCsmacd template located in /Server/SSH/Linux, we cannot see any graphs because this template is BLANK. However, since for the other devices, the ethernetCsmacd_64 template is assigned, and this template is located in /Devices (which applies to all devices) and it has all the graphs we need, then this is why these devices were displaying these graphs.
Implementing a Solution
A possible solution to this is to create a new custom ZenPack that applies all the datasources, datapoints, thresholds, and graphs from ethernetCsmacd in /Devices into ethernetCsmacd in /Server/SSH/Linux/NovaHost.
So I proceeded to create a new ZenPack using zenpacklib and define everything that is already defined in /Devices's ethernetCsmacd, but now into /Server/SSH/Linux/NovaHost. These definitions are constructed inside the ZenPack's zenpack.yaml file.
-> I have uploaded this ZenPack to my GitHub and you can browse the source code or just install it in your Zenoss Core to fix the issue. I am sure there are identical or similar ZenPacks out there to address this particular issue.
After finishing the ZenPack and installing it, we can check that ethernetCsmacd has a new location /Server/SSH/Linux/NovaHost with all the elements needed. Our devices will now surely use this template since they both possess the same device class.
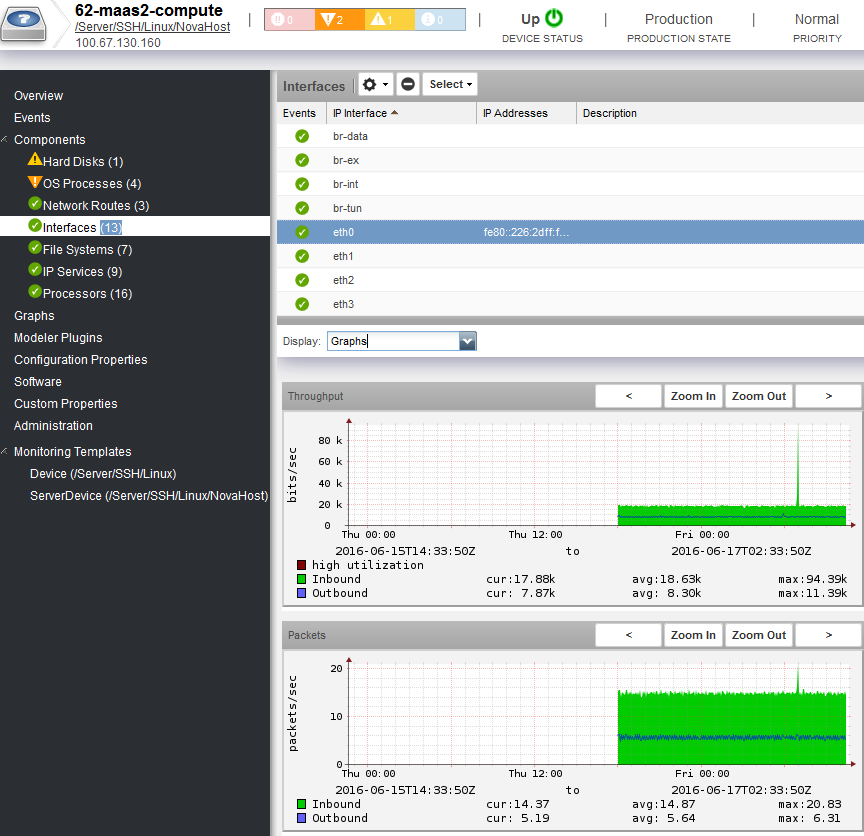
If re-model our devices and check the Interfaces components, we can see that indeed we now have network interface graphs (Throughput, Packets, Errors) for our the OpenStack devices:
~> UPDATE: It seems that the current latest version (2.1.2) of the LinuxMonitor ZenPack fixes this issue and adds the interface monitoring templates to the /Server/Linux device class, which consequently will also provide the template for the NovaHost class.