Monitoring CPU Utilization in Zenoss
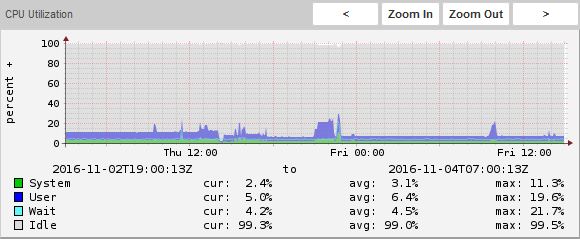
While taking a look at the CPU Utilization graphs offered Zenoss Core's Linux Monitor ZenPack (v1.2.1), I noticed that the percentage values for Idle were ridiculously high:
This made sense since this particular device contains 16 cores. However, this then means that the monitoring template isn't really taking this into consideration, and instead just spits out the total value from all cores.
Browsing at the Device (/Server/SSH/Linux) monitoring template quickly reveals the data point responsible for this value, ssCpuIdle.ssCpuIdle. This data point has a Python alias responsible for rendering the CPU percentage:
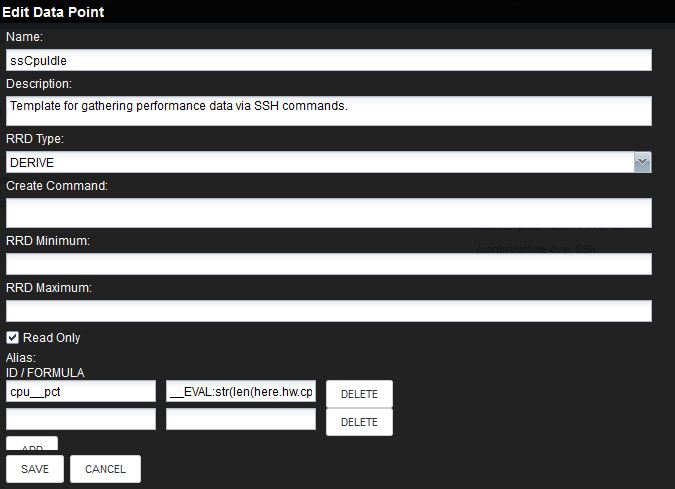
The formula for this alias is:
__EVAL:str(len(here.hw.cpus())) + ',/,100,EXC,-'
The above formula uses a combination of Python to generate a string in Reverse Polish Notation (RPN) format, which is the format that rrdtool (the tool responsible for generating the graphs) uses.
Strangely the RPN field in the graph point appears to be blank:
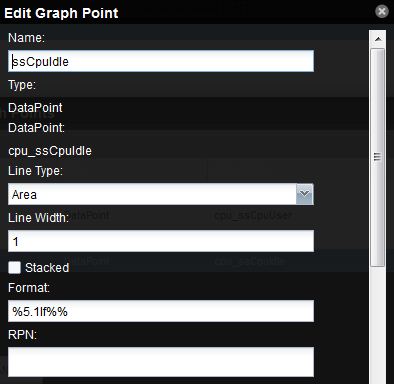
We could easily fix the issue by adding a value to this RPN field, for example:
16, /
Which means to divide the data point's value by 16 (# of cores). This would reduce the 1500% value to something around 99%. However this solution is not optimal because you are hardcoding the number of cores in the field.
Linux Monitor v2.0.6
Interestingly, v2.0.6 of Linux Monitor ZenPack was released just 3 days ago. And you might be wondering why I am still even talking about v1.2.1 ? The reason is because this is the default Linux Monitor ZenPack that the Zenoss Core autodeploy script for Ubuntu uses.
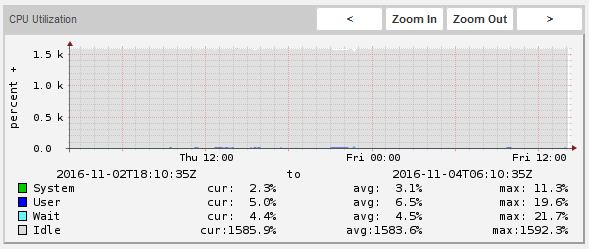
Anyways, I decided to give this new version a try and see if it solves the issue. After installing the ZenPack and browsing the device's CPU Utilization graph, I find this:
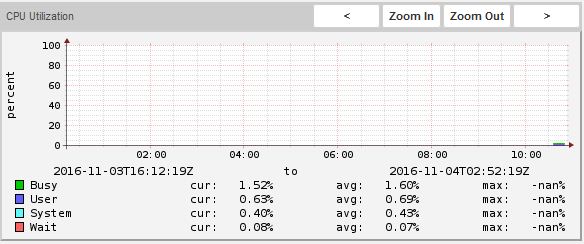
The values have indeed been reduced. However, it seems that Idle has been replaced by Busy? Also, the value doesn't really match to the expected one (~99%).
A glance of the same monitoring template for this version reveals a change of data points: ssCpuIdle being replaced by ssCpuIdlePerCpu. The cpu___pct alias and the graph point RPN now use the following formula:
100,EXC,-,0,MAX
At this point I felt that this new ZenPack version wasn't making things more clear as I thought it would. After some research, I found that apparently CPU Utilization measuring is not a simple subject.
According to a user in Zenoss forum discussion:
CPU utilization is very very tricky. It starts with the fact that I've yet to see a consensus as to how you should even calculate it (just at the OS level). There are at least 2 sets of OIDs you could use, and you have to take number of cores into account. Doesn't help that different OSs do it differently. I personally mostly ignor CPU utilization because of the issues - search the forums for some really long threads on all the factors here. I use load average on Linux instead, and on Windows I take the CPU use with a grain of salt. Now, this lack of care is probably local to my environment, but consider - what are you using the CPU utilization for? Alerts? Planning? It's probably important to understand what the numbers Zenoss is getting mean, and then we can customize that data to make more sense - you've already seen event transforms for munging it to human readibility - you can also alter RPNs and graph definitions (though you'll lose historical data doing this) to change what the graphs are showing.
A Possible Solution
Going back to Linux Monitor version 1.2.1's, I decided to try to dynamically specify the number of cores into the RPN formula of the graph point. I managed to do this using a TALES expression:
${here/hw/cpus/countObjects},/
And voila! My graph is now looking just the way I want it to: